Topographer
Portfolio
The Portfolio is every project’s front page. It scores the applications you survey, shows where each one stands, and ranks the fixes by how much they improve across all of them. Select Portfolio on the top bar, or the logo, to open it.
Subjects and portfolios
Each application you survey is a subject, under the name you gave it when you surveyed it (for example payments-api in spice survey inventory payments-api ./build/libs; see Choose a subject). The Portfolio counts every subject in the project. This view is called All subjects in the portfolio switcher on the top bar.
Everything on the Portfolio stays within one project. To compare a group of subjects on their own, create a custom portfolio.
The three scores
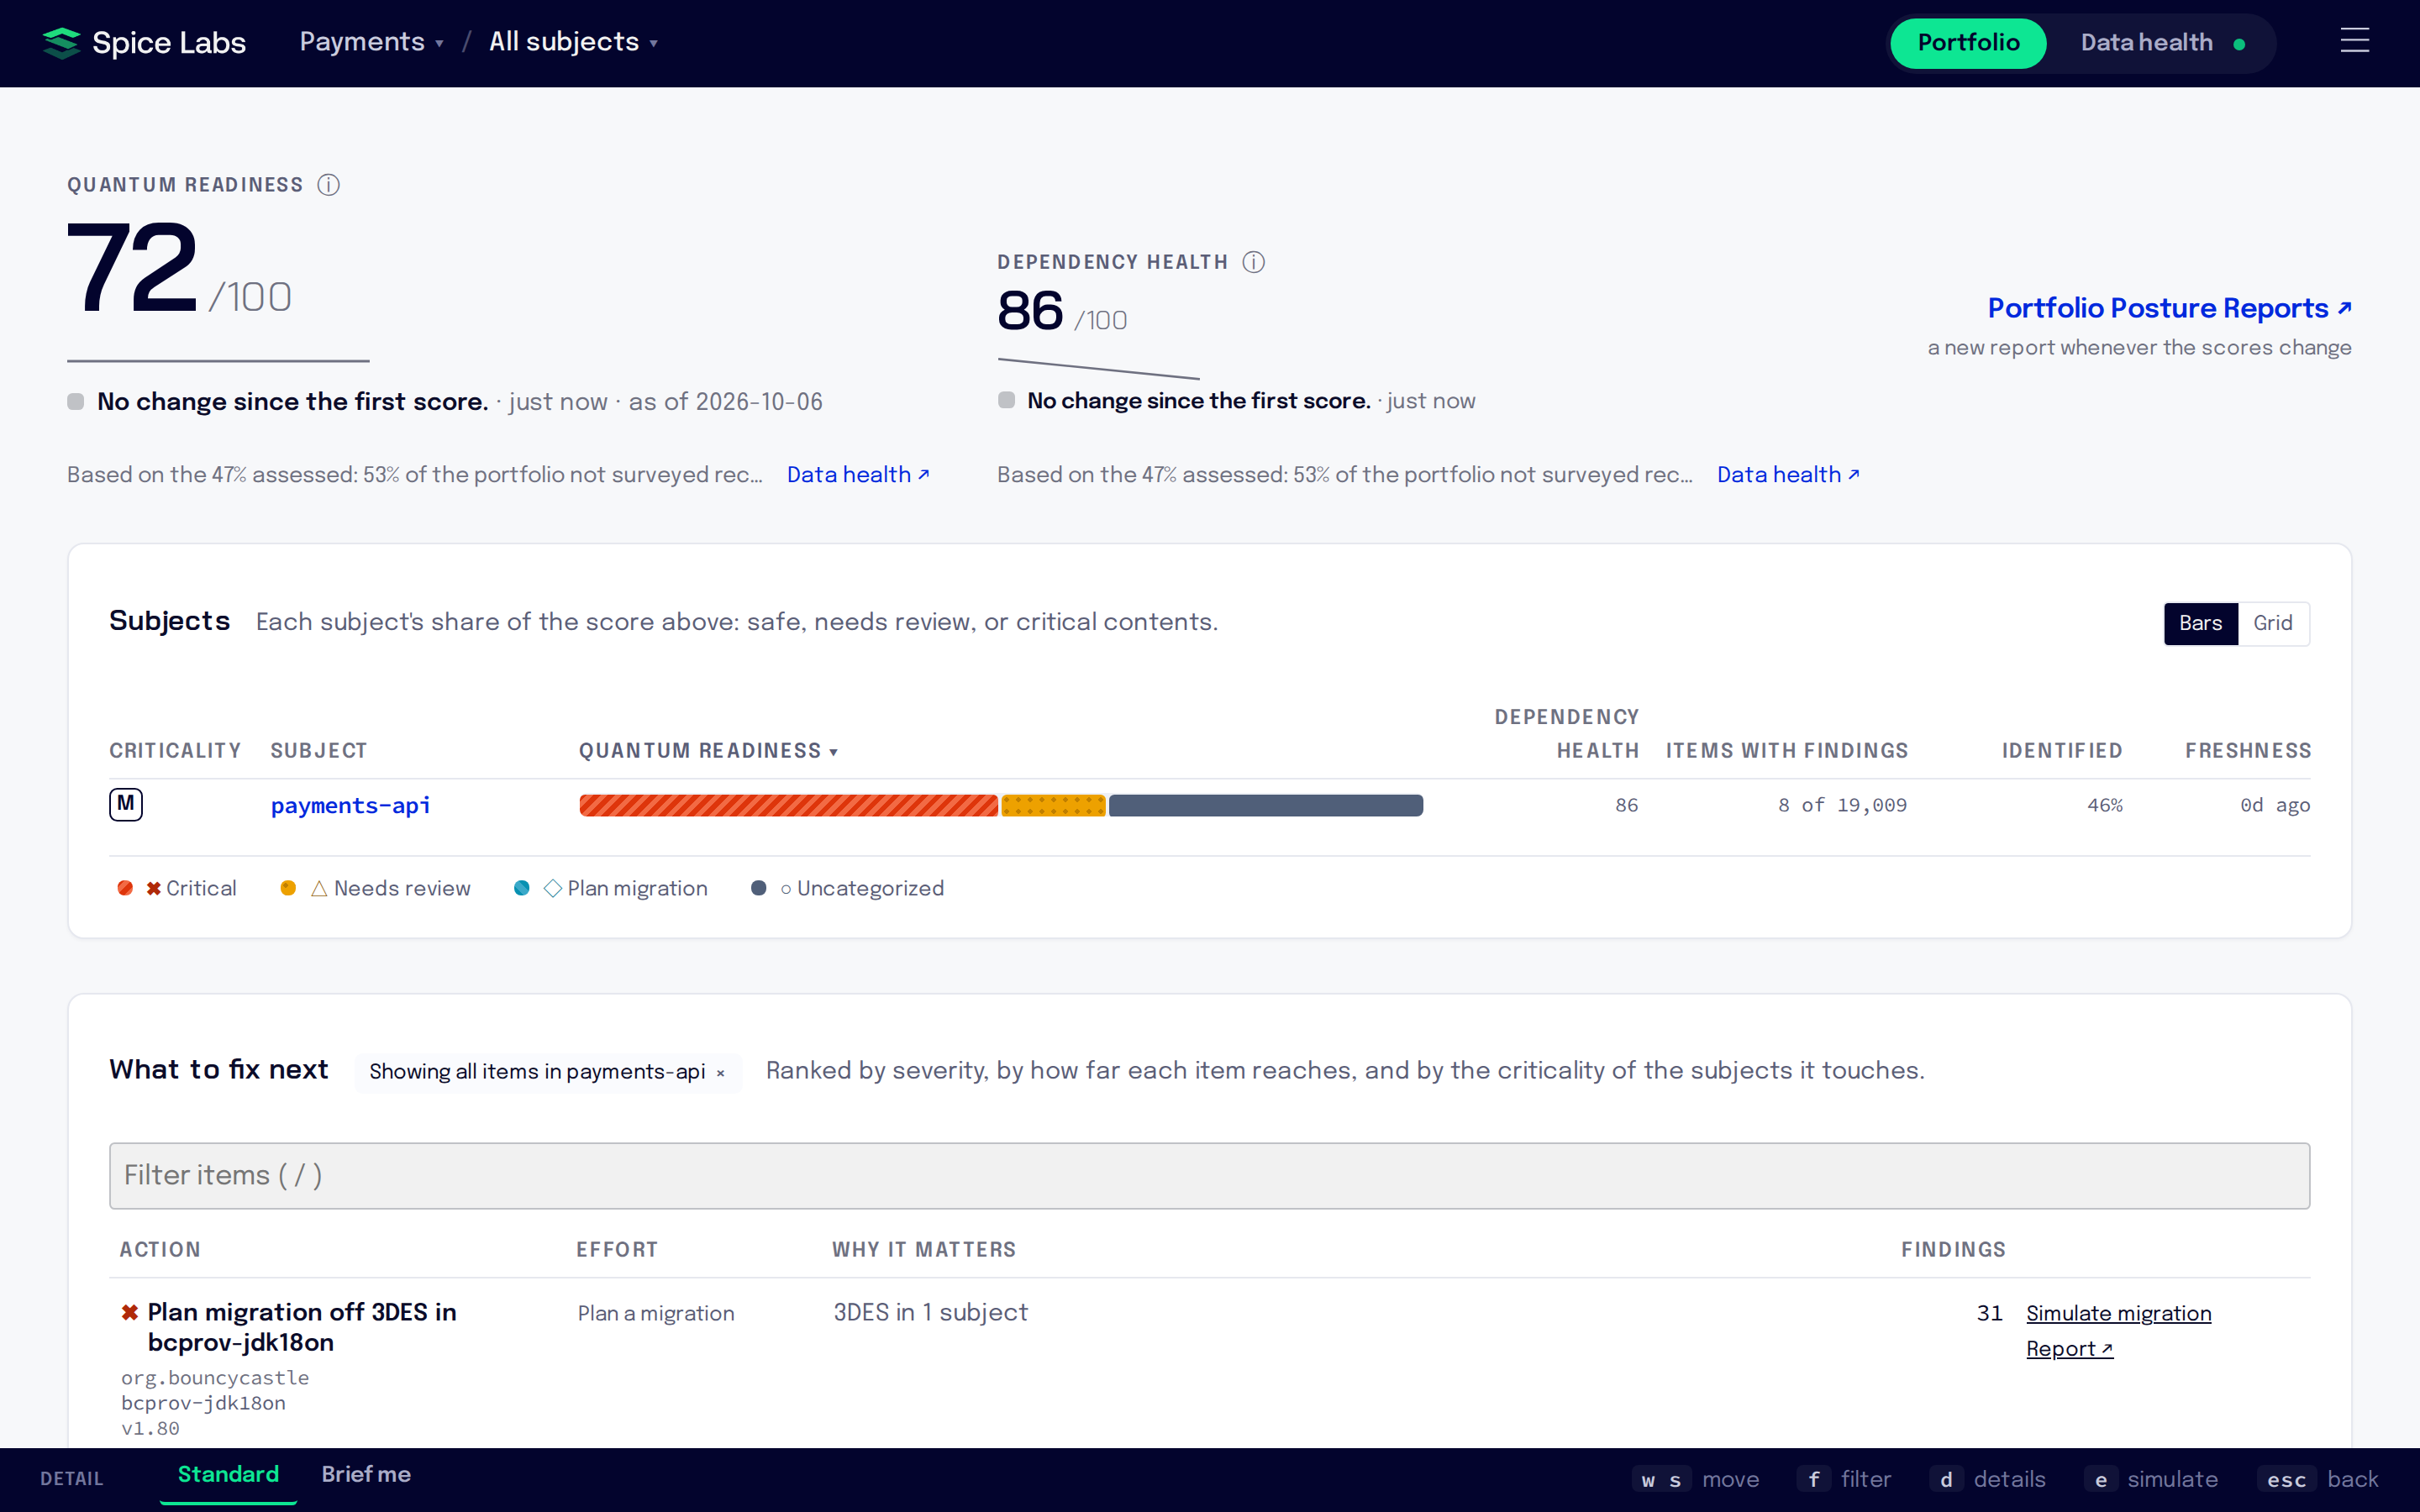
The top of the page shows three scores, each a single number out of 100:
| Score | What it measures | What moves it |
|---|---|---|
| Quantum readiness | How much of the portfolio’s contents is quantum-safe, weighted by each subject’s criticality. 100 means everything assessed is quantum-safe. | Fixing critical and needs-review findings, re-rating criticality, new surveys. |
| Dependency health | How much of the portfolio’s contents is free of known vulnerabilities, weighted by criticality. 100 means everything assessed has no known vulnerabilities. | Fixing vulnerable items, re-rating criticality, new surveys. |
| Crypto agility | How easily the portfolio’s cryptography can be changed. Configuration-level choices score higher than hardcoded call sites. | Replacing hardcoded uses with configurable ones. |
Select the info button beside a score, What this score measures, to read its definition in the dashboard. Advisory data for Dependency health comes from OSV. If your project does not show Dependency health, that score is turned off for the project. Right after a subject’s first survey, Dependency health reads “Not scored yet” until its packages have been checked for known vulnerabilities; the page updates by itself when the score is ready.
A score covers the subjects surveyed recently. When some subjects have not been surveyed recently, a line under the number says how much of the portfolio it is based on, for example “Based on the 80% assessed: 2 subjects not surveyed recently”. When too little recent data is left, the score reads “Not enough recent data to score” until fresh surveys arrive.
A subject with no survey in 90 days is left out of the scores, the ranking and the counts. The Portfolio says how many (“3 apps are not counted in these figures (no survey in 90 days)”) and links to Data health. Survey the subject again and it counts again.
Score history
Select the small trend chart on a score to open its history, for example Quantum readiness over time. Every movement has exactly one cause, and the record is never rewritten:
- You shipped: new surveys changed what is in the portfolio.
- You re-rated: someone changed a subject’s criticality.
- The world changed: what is publicly known about your components changed, such as a new advisory.
- Scoring logic changed: Spice Labs changed how the score is calculated. The chart marks these as boundaries.
The Subjects list
The Subjects card lists every subject in the portfolio. Switch between two views:
- Bars: one row per subject, with Criticality, Subject, a bar for the score you pick (Quantum readiness, Dependency health or Crypto agility), Items with findings, Identified and Freshness.
- Grid: the ranked fixes down the side and the subjects across the top, so you can see which subjects each fix touches.
The bar colors follow the legend under the card. For Quantum readiness: Critical, Needs review, Plan migration and Uncategorized (the grid adds Safe). For Dependency health: Critical, High, Medium, Low and Unscored.
Identified is the share of a subject’s contents, by bytes, that its latest survey identified as known packages. Unidentified content is not assessed, so a low figure means the scores describe less of that subject. Freshness shows when the subject was last surveyed.
Set a subject’s criticality
Criticality tells the scores which subjects matter most. Every subject starts at medium.
-
Select the criticality chip
In the Criticality column of the Bars view, select the subject’s H, M or L chip. A menu titled Set criticality opens.
-
Choose High, Medium or Low
Optionally fill in Why? (optional) so others know the reason.
The rating is saved right away. The scores take a few seconds to update while an Updating banner shows. People with the Admin or Member role can set criticality; the Viewer role cannot (Teams and roles).
What to fix next
The What to fix next card ranks the fixes that would improve the portfolio. Items are ranked by severity, by how far each one reaches, and by the criticality of the subjects it touches. A shared library with a critical finding inside twenty of your applications ranks above a similar finding in one: one fix improves twenty apps.
Each row shows:
- Action: the fix in a sentence, such as “Upgrade library to version” or “Patch library in subject”.
- Effort: how big the change is likely to be, such as “Version bump available”, “Config change”, “Code change likely” or “Plan a migration”.
- Findings: how many findings the fix resolves, and “in N apps”, how many subjects it reaches. Hover for the breakdown by subject.
Type in Filter items (or press /) to narrow the list. The list shows the worst items first; select Show more at the bottom for the rest.
Select a row to see its details: What is wrong, What to do, Where it is, Identifiers (with buttons to copy the gitoid or purl) and Raw data. Report ↗ on a row opens the report the finding comes from.
Simulate a fix
Simulate shows what the scores would be if you made a fix, before anyone changes code.
-
Start a simulation
On a row in What to fix next, select its Simulate button. The label names the kind of fix, for example Simulate upgrade, Simulate patch or Simulate migration. Or select the row and press
e. -
Read the projected scores
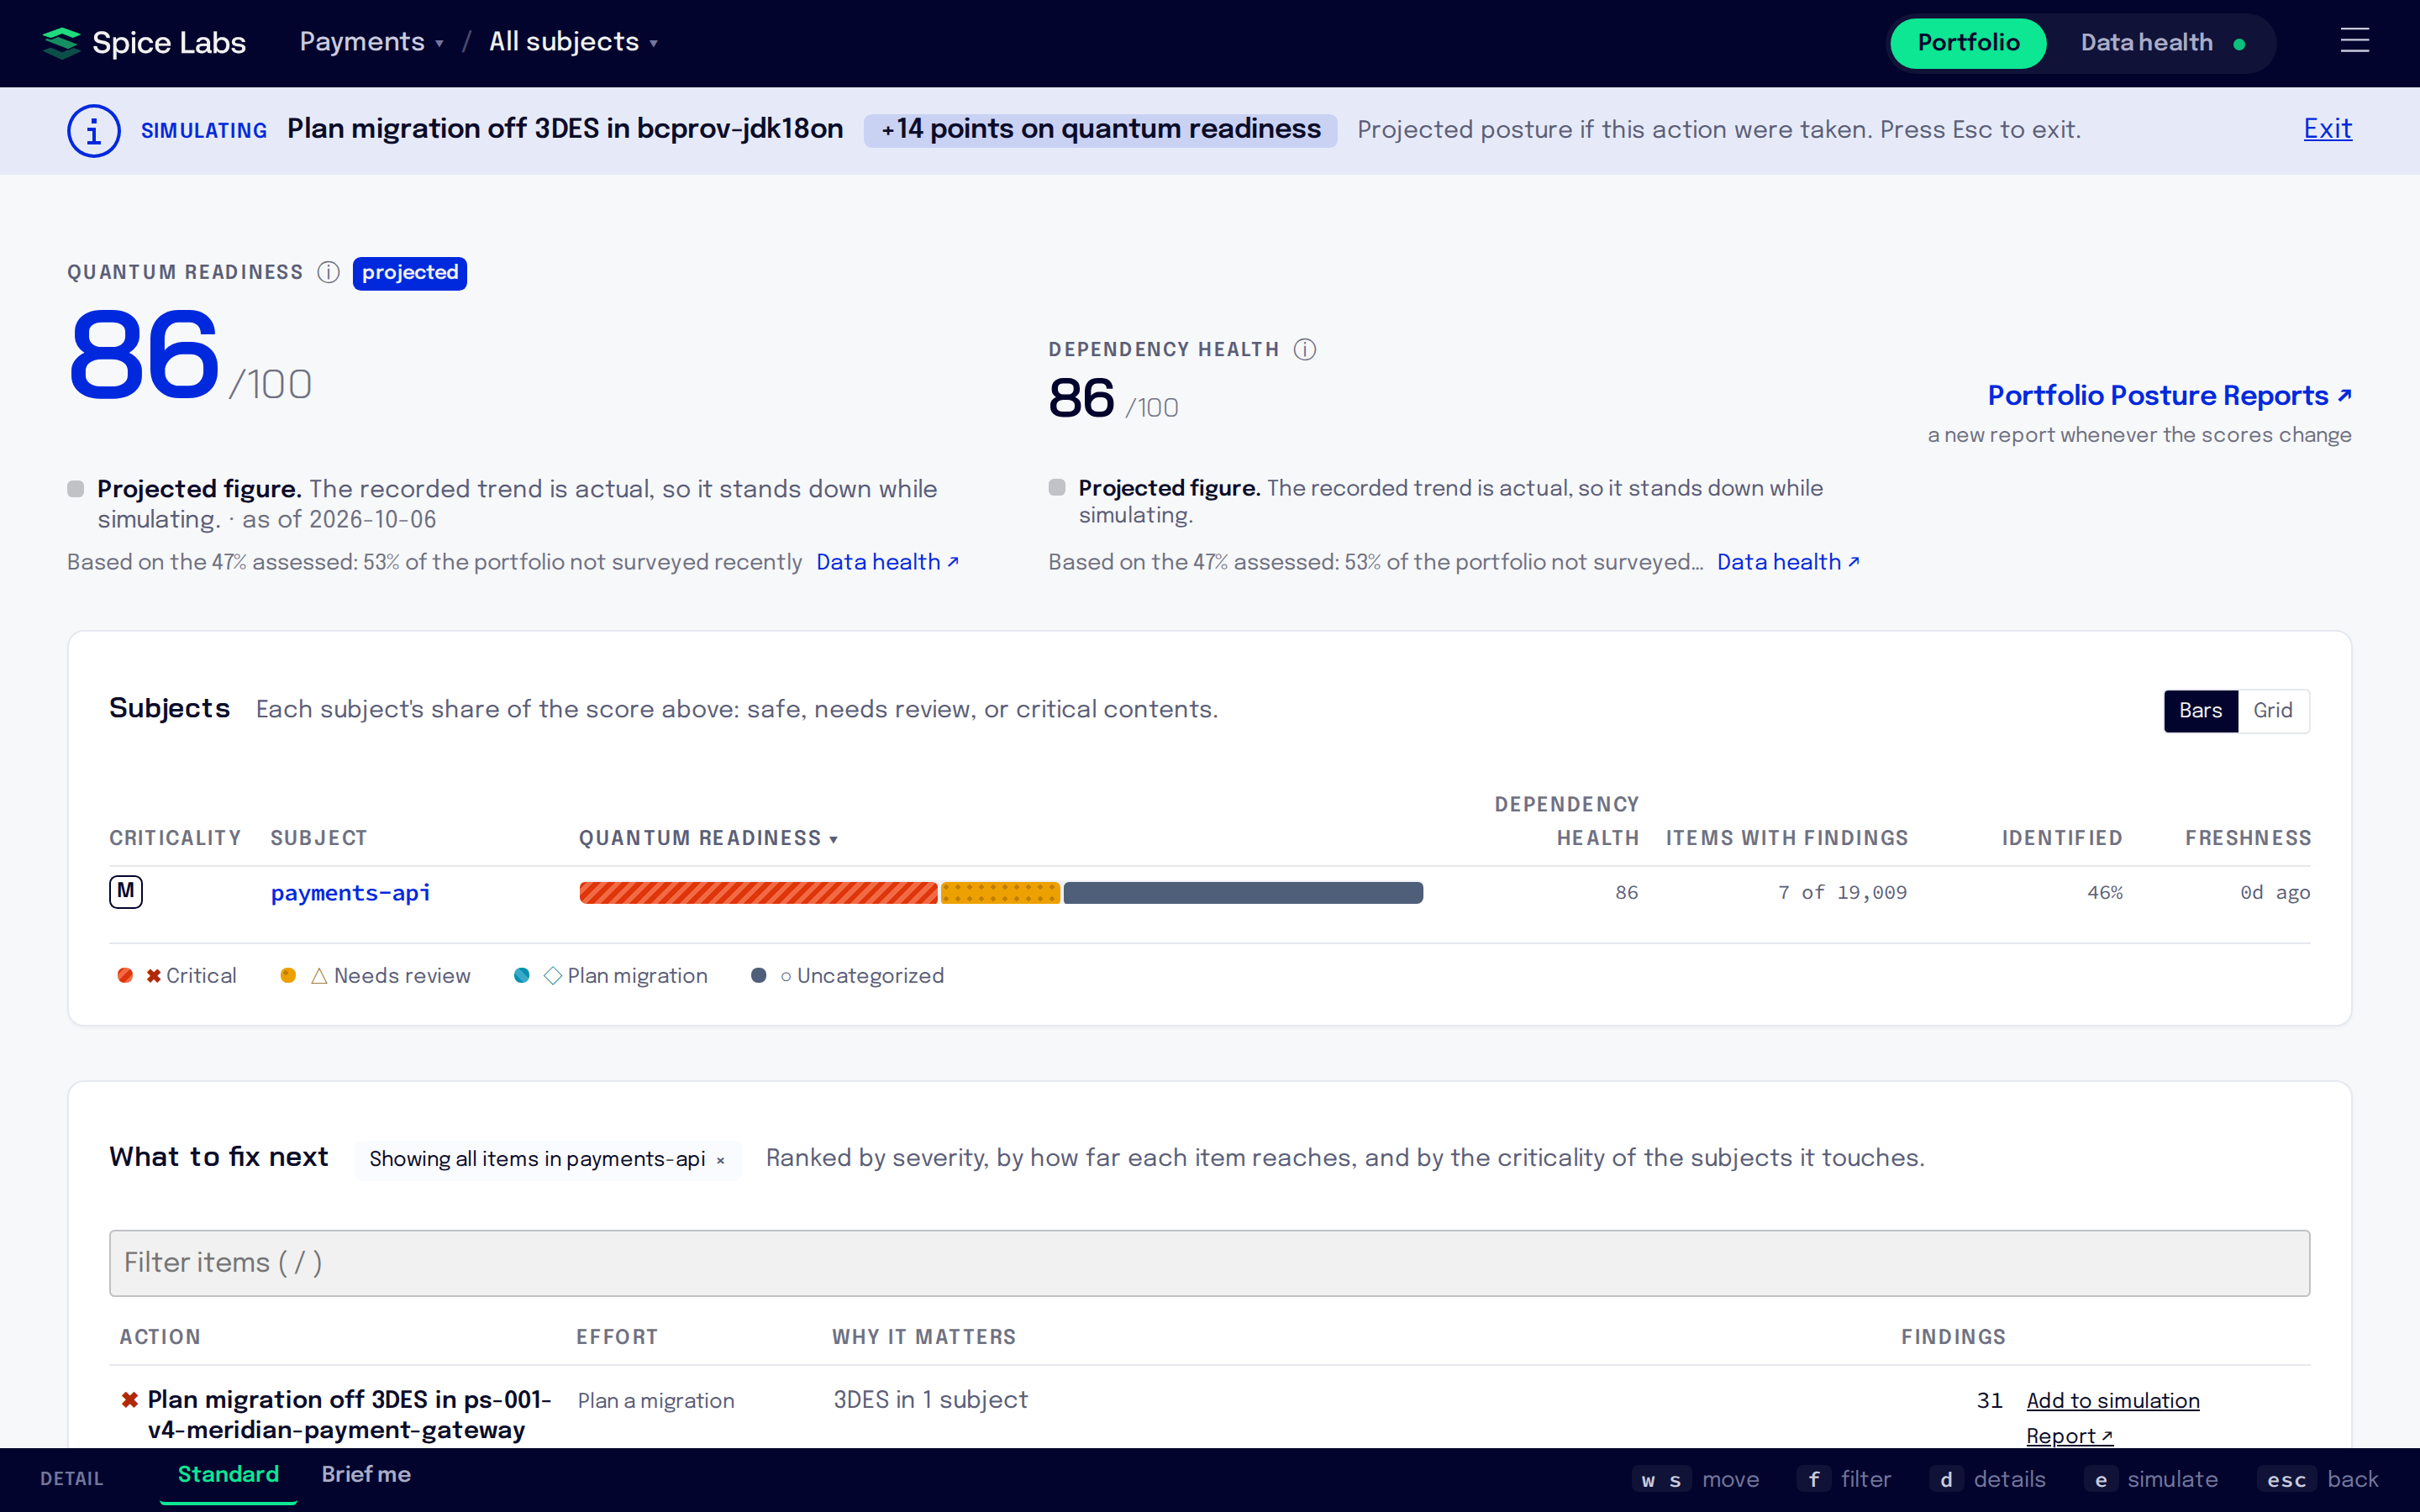
A Simulating banner names the fix and says “Projected posture if this action were taken.” The scores take a few seconds to recompute, then show what they would be after the fix.
-
Add more fixes
To simulate several fixes together, select Add to simulation on other rows.
-
Exit
Select Exit on the banner, or press
Esc, to return to the actual scores.
A simulation changes nothing: it is a projection, and the saved scores stay as they are. The link in your browser’s address bar keeps the simulation, so you can share it.
Custom portfolios
A custom portfolio scores a group of subjects you choose, such as one product line or one team’s services. It has its own scores and its own ranking of what to fix next.
- Create one: open the portfolio switcher on the top bar (it shows All subjects) and choose New portfolio. Give it a Name, tick its Subjects, and select Create.
- Change one: open it, then choose Edit portfolio in the switcher or on the Subjects card.
- Delete one: in Edit portfolio, select Delete portfolio. This removes the portfolio and its report history. The subjects and their surveys are not affected.
People with the Admin or Member role can create, edit and delete custom portfolios.
Portfolio Posture Reports
A posture report is a record of where the portfolio stood on a date: its scores, what would move them, and what would help. A new report is produced when the scores change and settle. Older reports are kept exactly as published, so the series is the history of what was known and what was advised.
Select Portfolio Posture Reports ↗ at the top right of the Portfolio to see the list. Each row shows the date, the version, and a status:
- Current: the newest report.
- Superseded: a newer report replaced it.
On each row, View opens the report in the dashboard, and one button per format downloads it: HTML, PDF, XLSX, CSV, PPTX and JSON. The buttons show only the formats that have finished rendering.
Regenerate produces a current report again, for the same date, with the current report version. People with the Admin or Member role see it. It is not offered on superseded reports.